There aren’t individual dated entries, but this is basically a dev blog. I’m recording my thoughts and findings as I discover how MU is calculated in Ingress. Once I have a good theory and some kind of field planning tool as a result, I’ll write an article about it.
The consensus among redditors (see KevinC for example) seems to be that MU is calculated by computing coverage of s2 cells with an s2 cell to population database. It’s claimed that portal data can’t explain observed MU numbers and in particular the rare case where a large field has less MU than a smaller field it completely encloses. To my thinking, such anomalies are better explained by using area of the triangle and per-portal weights than an s2-based database. Also, area as opposed to say leg lengths better explains the so-called Divide by Zero bug that once existed.
Unfortunately, nobody has shown their work to disprove portal weights. So here goes…
Assuming the formula is (p1+p2+p3)*area = MU, where pi is some population factor that gets baked in to the portal data when the portal is created, then a single field gives us one equation with three unknowns. If we add a 4th point and consider 4 triangles (abc,abd,acd,bcd), then we have 4 equations and 4 unknowns which will allow us to solve for the portal weights of those particular portals. Using a 5th portal with three of the previous portals will give us another system of 4 equations and 4 unknowns that can be used to verify the original computed weights.
There is one other unknown. We don’t know exact MU. If your field is worth 8.1425 MU, you’ll be awarded 8 MU or maybe 9 MU depending on whether they floor, ceil or round. So with the data collected from any 4 portals, we have a system of linear equations sort of.
p1 + p2 + p3      = MU123/area123 where i<MU123<i+2 for some integer i
p1 + p2      + p4 = MU124/area124 where j<MU124<j+2 for some integer j
p1      + p3 + p4 = MU134/area134 where k<MU134<k+2 for some integer k
     p2 + p3 + p4 = MU234/area234 where l<MU234<l+2 for some integer l
So, we can’t solve for exact p1,p2,p3,p4. We can solve for ranges for each. Adding more data will either refine those ranges or disprove the assumption that the formula is correct. If we disprove the formula, we can try line segment lengths. If line segments lengths can be similarly disproven, we can try to deduce the s2 levels and population data at those levels for the area spanned by these particular fields. Given the number of s2 levels, that seems pretty daunting.
Data collection
In the first data collection outing, I made the mistake of making a layered field and got less data than intended.
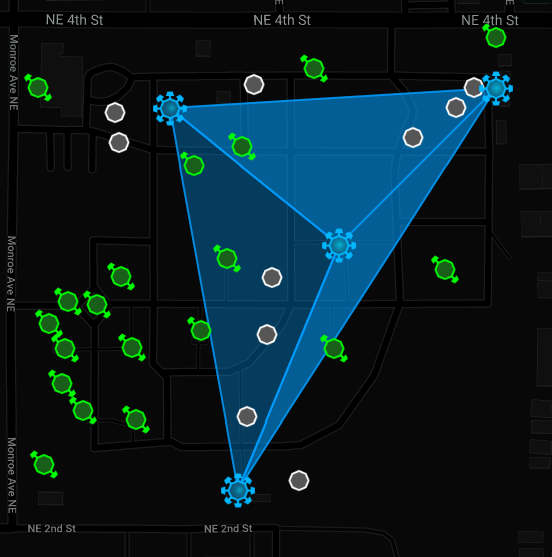
The initial 4 portals are (p1) Metamorphosis in the Northwest, (p2) East Memorial Wall in the Northeast, (p3) Memorial Fountain in the center and (p4) South Lawn Memorial in the South.

For areas, we’ll want to use a spherical geometry area. The google maps geometry library had an area function that can be used.
        let triangle = [new google.maps.LatLng(47.488078,-122.169664),

                        new google.maps.LatLng(47.486942,-122.171348),

                        new google.maps.LatLng(47.485165,-122.172433)];

        let area = google.maps.geometry.spherical.computeArea(triangle);

        console.log(area);
p2,p3,p4 was 8 MU (so actual MU was greater than 7 and less than 9) and the area of the triangle 47.488078,-122.169664 to 47.486942,-122.171348 to 47.485165,-122.172433 is 7368.210755235674 (square meters)
p1,p2,p3 was 17 MU (so actual MU was greater than 16 and less than 18) and the area of the triangle 47.48793,-122.173166 to 47.488078,-122.169664 to 47.486942,-122.171348 is 15613.401138994961 (thank goodness it wasn’t between 16k and 18k. That first one had me nervous).
It took a while to get data for the other triangle and in the meantime I realized why MU can’t be computed just at the portals. If you make a very large field with 3 remote mountain portals, the MU is much higher if there’s a city in between than if there isn’t. While pondering this, I also realized that while we can never get the underlying population map used by Niantic, we can get a very good approximation by making small fields like this and using Voronoi regions around the portals. Collecting enough data to map a region would be tricky. Scraping comms, in addition to being unethical and a violation of the TOS, wouldn’t work because you have to guess which links are in the field unless you scrape so much data that you have every link created and every resonator destroyed. Anyway…

p1,p3,p4 is 17 MU. This triangle has an area of 18014.800858524974
The big triangle, p1,p2,p4 is 42 MU with an area of 40996.4127527556.
And as an added bonus, a new portal in the mix is p5, Jimi Hendrix Memorial

p1,p4,p5 is 13 MU. It has an area of 13387.71415. We’ll get back to Jimi in the next round of linear equations. With the original 4 portals, we now have 4 equations for the 4 unknowns. Excel has matrix multiplication, so we can paste the data into Excel and get the answer. Excel also has a “spin button” that lets you put in a field that can easily be limited to a range so we can do the ±1 thing with the MU values to get the range for the portal weights.
Today I learned that the spin button only supports integer values. No biggie. I also discovered that cranking all the MUs to their max and min does not give the max and min values of the variables being solved for. That was a naive hope. I’ll have to think more about solving systems Ax=b for x when it’s really solving Ax=b(range) for x(range). Here’s the Excel.

The formula in B8:B11 is {=MMULT(MINVERSE(A2:D5),E2:E5)}. The mid, min and max columns are the pasted values of the solutions when all of the MUs are at their min (reported MU – 1), their mid (reported MU), and their max (reported MU+1). The two unlabeled columns in the bottom right are the min and max of columns B through F. With all of the MU at max, I nudged the first MU value down from 18 to 17.9 and got a new min for p1. So how to find the ranges for p1, p2, p3 and p4? Linear programming doesn’t quite fit. Or I’m just not seeing how to construct the objective function.
We’re solving the wrong formula since the right formula is going to be intersecting the triangle with s2 cells of population data (or some other map layer with population data), but for the sake of completion, let’s plow on with the wrong approach.
(1) w + x + y     = A
(2) w + x     + z = B
(3) w     + y + z = C
(4)     x + y + z = D

A bunch of sloppy and error prone algebra later...
(it seems like there should be more symmetry in the solution)

w = (4A-5B-C-2D)/3
x = (A-4C+D+B)/3
y = (A+5C+D)/3
z = (D-2A+B-C)/3
So… in the Excel sheet, p1 should be maxed with the first range maxed and the other ranges at their minimum. And that seems to be the case. Yay!
Some subset of these portals is going to have the same underlying population constant, but it’s not uniform for all of the portals. We know that because two very different areas, 15k m^2 and 18k m^2 both produced 17 MU. p1,p2,p3 has a higher underlying population than p1,p3,p4. East Memorial Wall must be close enough to the neighborhood east of the graveyard to have a higher population. To find the population of the graveyard, we’ll have to gather MU numbers from lots of triangles within the graveyard that have consistent MU to area ratios.
The areas of the triangles for all the portals in the Greenwood Memorial Park (computed as above) are:
| Area | MU | Area/MU | Area/(MU-1) | Area/(MU+1) | |
| Metamorphosis – Memorial Fountain – South Lawn Memorial | 18014.80086 | 17 | 1059.694168 | 1125.925054 | 1000.82227 |
| East Memorial Wall – Memorial Fountain – South Lawn Memorial | 7368.210755 | 8 | 921.0263444 | 1052.601536 | 818.6900839 |
| Metamorphosis – East Memorial Wall – Memorial Fountain | 15613.40114 | 17 | 918.4353611 | 975.8375712 | 867.4111744 |
| Metamorphosis – East Memorial Wall – South Lawn Memorial | 40996.41275 | 42 | 976.1050655 | 999.9125062 | 953.4049477 |
| Metamorphosis – Jimi Hendrix Memorial – South Lawn Memorial | 13387.71415 | 13 | 1029.824165 | 1115.642846 | 956.2652962 |
| Garden of Harmony – Love Forever Headstone – Fish Fountain | 2100.091108 | 2 | 1050.045554 | 2100.091108 | 700.0303692 |
| Garden of Harmony – Iu-Mienh Community Memorial – Fish Fountain | 2475.688882 | 2 | 1237.844441 | 2475.688882 | 825.2296274 |
| Iu-Mienh Community Memorial – Fish Fountain – Prisoner of War Memorial | 2119.202046 | 2 | 1059.601023 | 2119.202046 | 706.400682 |
| Love Forever Headstone – Fish Fountain – Prisoner of War Memorial | 3727.706351 | 4 | 931.9265877 | 1242.568784 | 745.5412702 |
| Garden of Harmony – Iu-Mienh Community Memorial – Fountain of Youth | 3235.965542 | 3 | 1078.655181 | 1617.982771 | 808.9913854 |
| Garden of Harmony – Love Forever Headstone – Remembered Forever | 3271.658364 | 3 | 1090.552788 | 1635.829182 | 817.9145911 |
| Garden of Harmony – Remembered Forever – Fountain of Youth | 3170.971246 | 3 | 1056.990415 | 1585.485623 | 792.7428115 |
| Yeah Yeah Thanks Puddin – Remembered Forever – Fountain of Youth | 5989.928659 | 6 | 998.3214432 | 1197.985732 | 855.7040942 |
| Iu-Mienh Community Memorial – South Lawn Memorial – Prisoner of War Memorial | 9797.498726 | 9 | 1088.61097 | 1224.687341 | 979.7498726 |
| Lullabyland Memorial – South Lawn Memorial – Prisoner of War Memorial | 3368.271922 | 3 | 1122.757307 | 1684.135961 | 842.0679805 |
| Lullabyland Memorial – Sun Dial – South Lawn Memorial | 3579.065871 | 3 | 1193.021957 | 1789.532936 | 894.7664678 |
| Lullabyland Memorial – Love Forever Headstone – Prisoner of War Memorial | 3508.57649 | 3 | 1169.525497 | 1754.288245 | 877.1441224 |
| Lullabyland Memorial – Renton Aerie No 1722 F.O.E. – Love Forever Headstone | 8879.929826 | 9 | 986.6588695 | 1109.991228 | 887.9929826 |
| Lullabyland Memorial – Renton Aerie No 1722 F.O.E. – Sun Dial | 6078.770277 | 6 | 1013.12838 | 1215.754055 | 868.3957539 |
| All to Myself I Think of You Memorial – Renton Aerie No 1722 F.O.E. – Sun Dial | 10618.79058 | 11 | 965.3445984 | 1061.879058 | 884.8992152 |
| All to Myself I Think of You Memorial – Renton Aerie No 1722 F.O.E. – Cedar View Memorial | 13253.79664 | 17 | 779.6350964 | 828.3622899 | 736.3220355 |
The S2 region cover of Jimi looks like this:
The next step is to get the S2 cells and the portals on the same map to be able to determine which fields span which levels of S2 cell cover. I downloaded the S2 geometry library and tried to get it to spit out reasonable amounts of data about the S2 subdivisions in the area I play, NR13-ROMEO-08, in a format that can be used from javascript with the google maps API.
I had a clever idea that failed. The thinking goes like this… if you take the bounds of the level 6 S2 cell that you’re interested in and subdivide it into 4 cells, you’ll have the level 7 cells. My mistake was doing a linear subdivision (linear in terms of lat/lng values). I split the cell by using a parametric equation along the edge. Comparing the linear subdivision of the level 6 cell into 64 segments along each edge with the actual level 12 cells, it’s way off. Blue is correct. Red is linear subdivision.

The code for subdividing in javascript looks like this:
        new google.maps.Polygon({
            path: [{"lat":47.994058,"lng":-122.242468},{"lat":47.430873,"lng":-123.977276},{"lat":46.457519,"lng":-122.693956},{"lat":46.984342,"lng":-120.994610}],
            strokeColor: '#0000FF',
            strokeOpacity: 0.5,
            strokeWeight: 1,
            fillOpacity: 0,
            map: map
        });

        // If that's the level 6 cell and we use a parametric line for subdivisions
        // level 7 is 0.5
        // level 8 is 0.25, 0.5, 0.75
        // level 9 is 1/8, 1/4, 3/8, 4/8, 5/8, 6/8
        // level 10 is 16ths
        // level 11 is 32nds
        // level 12 is 64ths

        // So... 64ths in red
        let p0 = {"lat":47.994058,"lng":-122.242468};
        let p1 = {"lat":47.430873,"lng":-123.977276};
        let p2 = {"lat":46.457519,"lng":-122.693956};
        let p3 = {"lat":46.984342,"lng":-120.994610};
        for (let t = 0.0; t < 1.0; t += 1.0/64.0) {
            // Line from a point on p0-p1 to a point on p2-p3
            let start = {"lat": t*p0.lat + (1-t)*p1.lat, "lng": t*p0.lng + (1-t)*p1.lng};
            let end   = {"lat": t*p3.lat + (1-t)*p2.lat, "lng": t*p3.lng + (1-t)*p2.lng};
            new google.maps.Polyline({
                path: [start, end],
                strokeColor: '#FF0000',
                strokeOpacity: 0.5,
                strokeWeight: 1,
                map: map
            });

            // Line from a point on p1-p2 to a point on p3-p0
            start = {"lat": t*p1.lat + (1-t)*p2.lat, "lng": t*p1.lng + (1-t)*p2.lng};
            end   = {"lat": t*p0.lat + (1-t)*p3.lat, "lng": t*p0.lng + (1-t)*p3.lng};
            new google.maps.Polyline({
                path: [start, end],
                strokeColor: '#FF0000',
                strokeOpacity: 0.5,
                strokeWeight: 1,
                map: map
            });
        }
    }
The code for generating the actual cell coverage looks like this:
S2LatLngRect rect;
S2LatLng point;
point = S2LatLng::FromDegrees(47.416464, -121.874288).Normalized();
rect.AddPoint(point);
point = S2LatLng::FromDegrees(47.859055, -121.705051).Normalized();
rect.AddPoint(point);
point = S2LatLng::FromDegrees(47.661905, -122.436668).Normalized();
rect.AddPoint(point);
point = S2LatLng::FromDegrees(47.373463, -122.395961).Normalized();
rect.AddPoint(point);

std::FILE * outFile;
outFile = std::fopen ("s2cells.json","w");
std::fprintf(outFile, "{");
char levelDelimiter[8];
std::strcpy(levelDelimiter,"");
for (int level=12; level<17; level++) {
S2RegionCoverer::Options options;
options.set_max_cells(100000);
options.set_min_level(level);
options.set_max_level(level);
S2RegionCoverer coverer(options);

std::vector<S2CellId> cells;
coverer.GetCovering(rect, &cells);

std::printf("Level %d produced %lu cells\n", level, cells.size());
char cellDelimiter[8];
std::strcpy(cellDelimiter,"");
std::fprintf(outFile, "%s\"l%d\":[", levelDelimiter, level);
std::strcpy(levelDelimiter, ",");
for (auto id : cells) {
std::fprintf(outFile, "%s", cellDelimiter);
std::strcpy(cellDelimiter, ",");
S2Cell cell(id);
char delimeter[8];
std::strcpy(delimeter, "");
std::fprintf(outFile, "[");
for (int i=0; i<4; i++) {
S2LatLng point(cell.GetVertex(i));
std::fprintf(
outFile,
"%s{\"lat\":%f,\"lng\":%f}",
delimeter,
point.lat().degrees(),
point.lng().degrees()
);
std::strcpy(delimeter, ",");
}
std::fprintf(outFile, "]");
}
std::fprintf(outFile, "]");
}
std::fprintf(outFile, "}");
std::fclose(outFile);
But… I think with the lat/lng points of the correct subdivisions along the edges, we can get a minimal amount of data out of the S2 library that can be used to quickly generate the tilings in the browser.
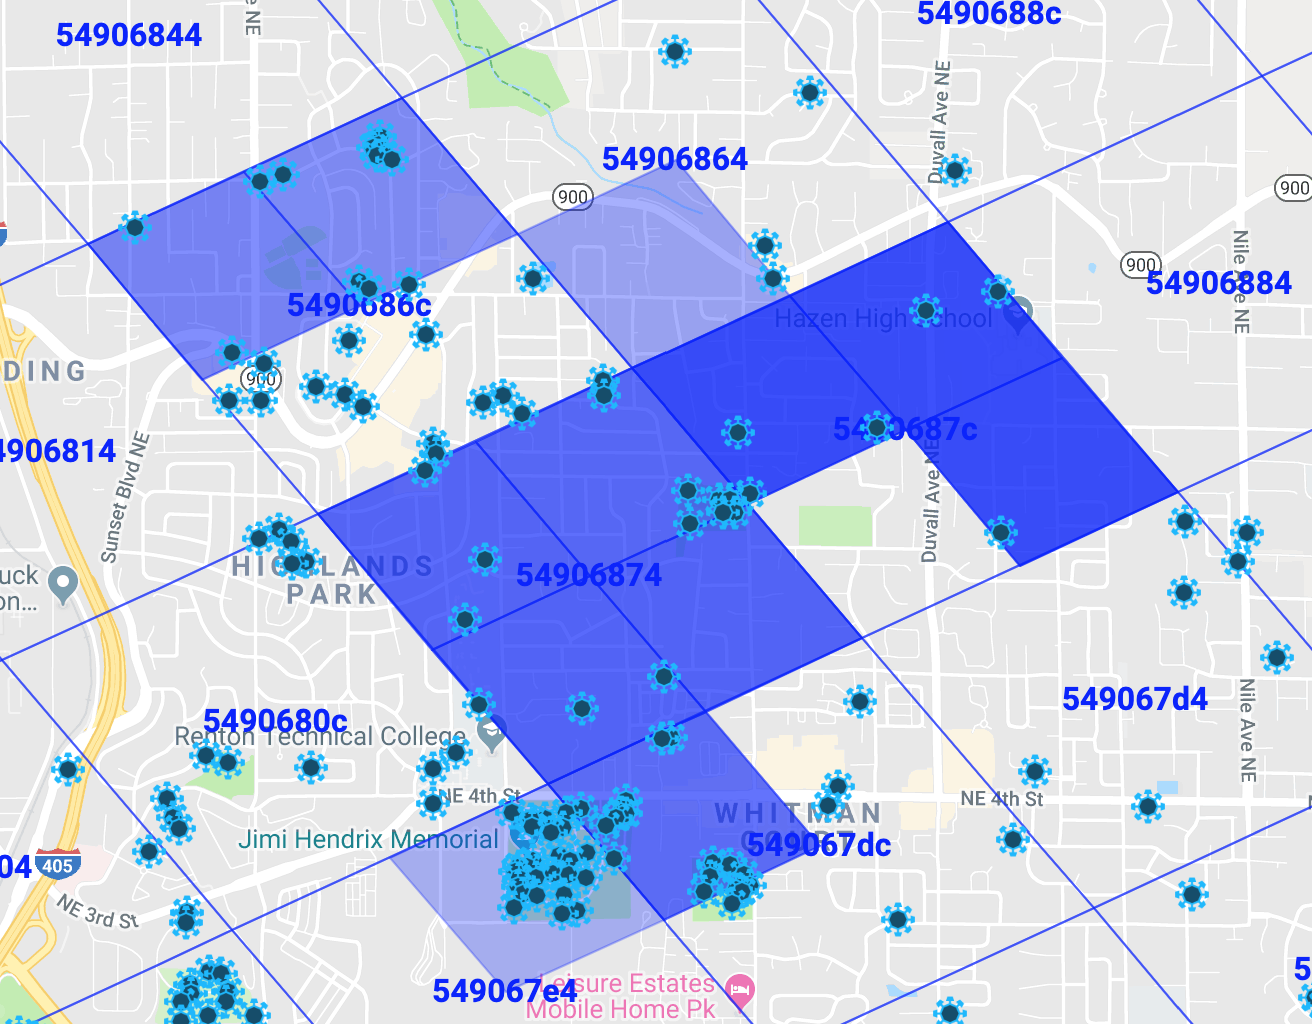
That subdivisions along the edges thing didn’t work out at all. Given one of the level 6 S2 cell edges, the region coverer generates cells for a very large area, the axis aligned bounding box perhaps. Maybe I should do an S2 geometry library to javascript Emscripten port. In the meantime, here’s how the portals in questions align with the S2 cell tilings.
Level 14: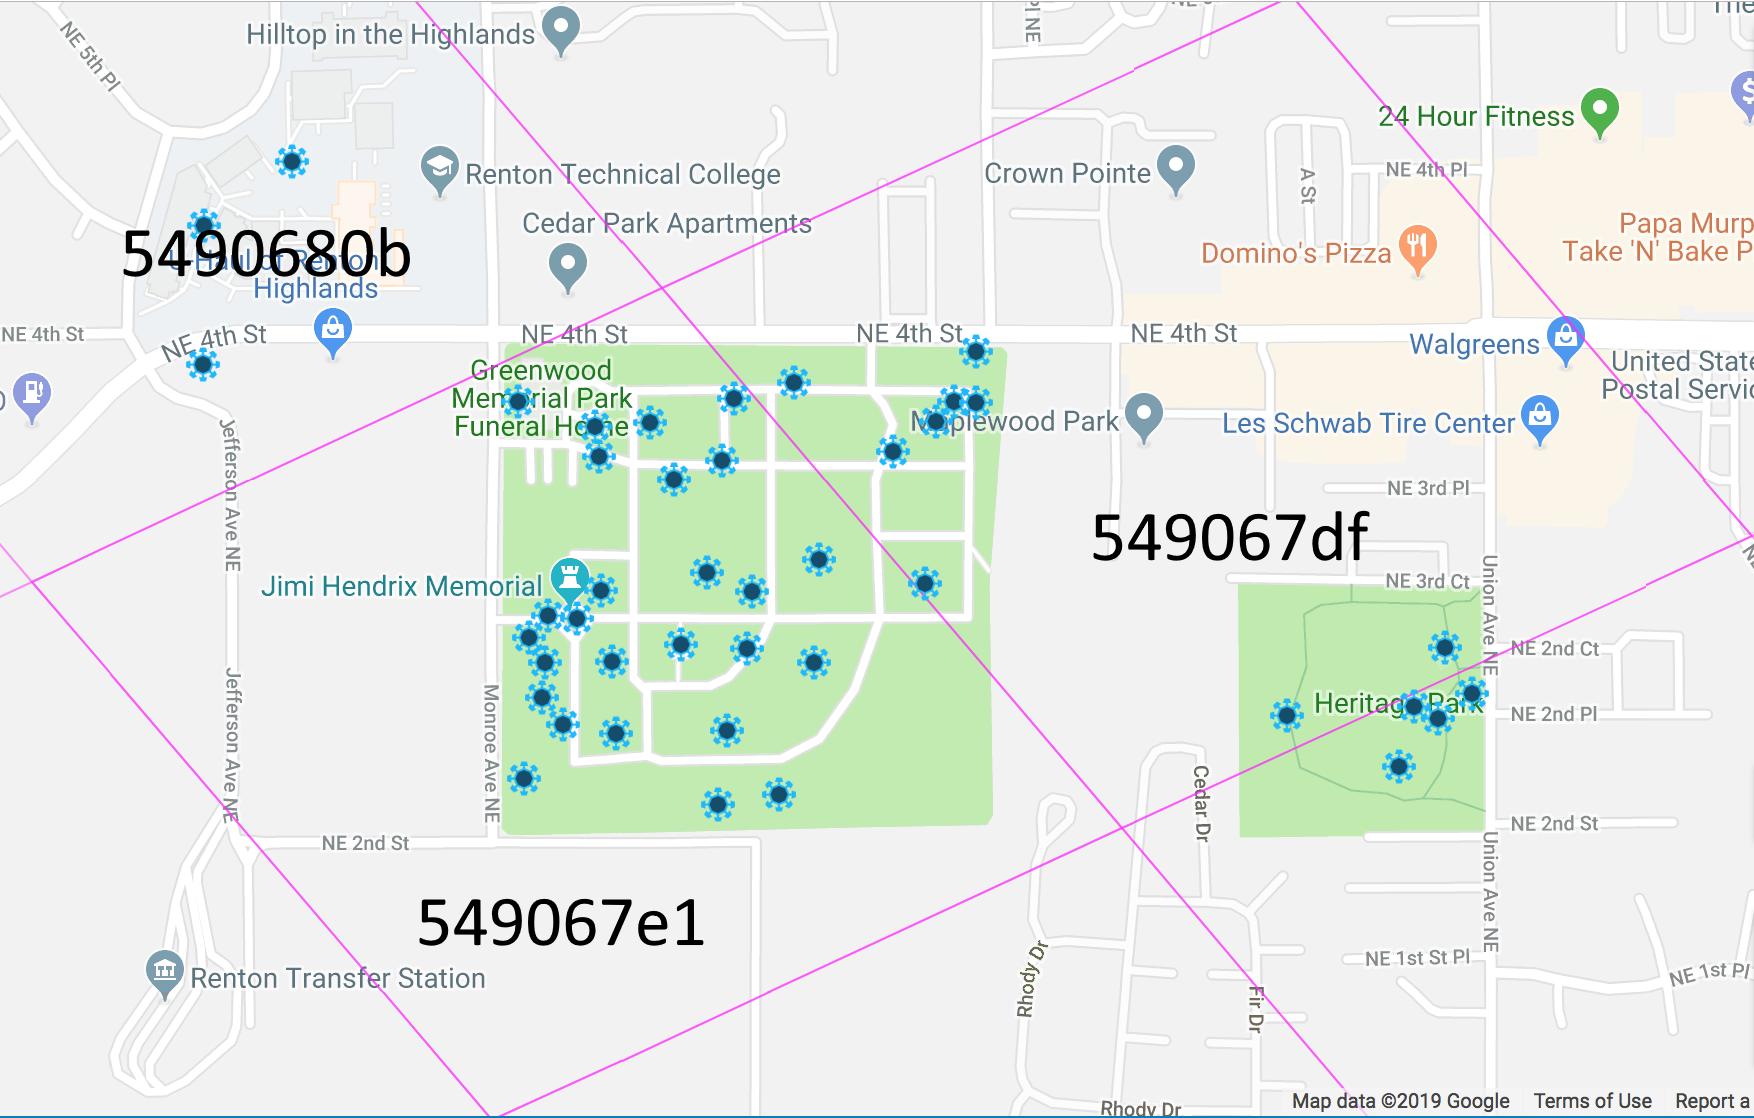
Level 15:
Level 16: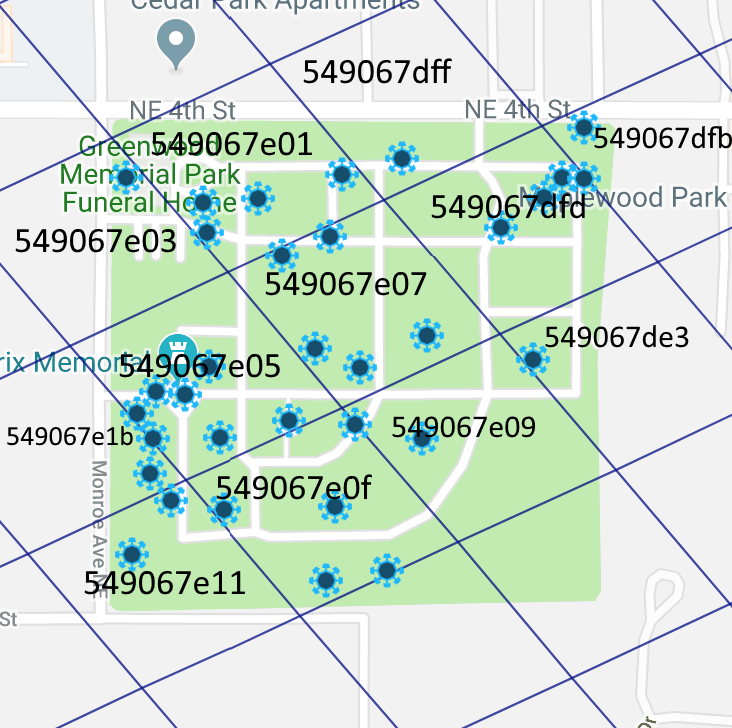
Of the fields for which we already have data, one of them is entirely in level 14 cell 549067df, 14 are entirely in549067e1, and 6 span both cells. We’ll need more data for the northeast cell before we draw any conclusions about it or about the fields that span cells. For the 14 in the south west level 14 cell, a population weight of 1050 with area/1050 rounded to the nearest integer produces the observed MU values.
These fields are all entirely within 549067df and are consistent with MU = round(area/780).
| Area | MU | |
| Cedar View Memorial – Greenwood Memorial Geometrical Fountain – East Memorial Wall | 1400.730006 | 2 |
| Little Free Library At Heritage Park – Greenwood Memorial Geometrical Fountain – East Memorial Wall | 13480.33324 | 17 |
| Basketball Half-Court At Heritage Park – Cedar View Memorial – East Memorial Wall | 7843.978627 | 10 |
| Little Free Library At Heritage Park – Basketball Half-Court At Heritage Park – East Memorial Wall | 23026.86693 | 30 |
| All to Myself I Think of You Memorial – Cedar View Memorial – Renton Aerie No 1722 F.O.E. | 13253.79664 | 17 |
One of the fields that spans both cells is Metamorphosis – East Memorial Wall – Memorial Fountain. Using the s2 geometry library, we can find the polygon which represents the intersection of that field with the cell 549067e1. Using the google maps geometry library, we can compute the area of the intersection as 8200.853169199234. If we divide that by 1050, we get 7.810336351618318.
The intersection of that field with cell 549067df has an area of 7406.250730416166. Dividing that by 780 gives is 9.49519324412329.
The sum of these is 17.305529595741608. The actual MU that we observed for the field is 17. So far so good.
Applying this method to all of the portals, we confirm that the guesses of 1050 as a divisor for cell 549067e1 and 780 for cell 549067df works with all the sampled fields. So the next step will to be gathering data for adjoining cells to start filling out the local map of population factors.
| Area | MU | 549067e1 area | 549067df area | 549067e1 MU | 549067df MU | Calculated MU | |
| Metamorphosis – East Memorial Wall – Memorial Fountain | 15613.40 | 17 | 8200.85 | 7406.25 | 7.81 | 9.50 | 17 |
| East Memorial Wall – Memorial Fountain – South Lawn Memorial | 7368.21 | 8 | 5374.66 | 2006.06 | 5.12 | 2.57 | 8 |
| All to Myself I Think of You Memorial – Renton Aerie No 1722 F.O.E. – Sun Dial | 10618.79 | 11 | 7490.62 | 3128.51 | 7.13 | 4.01 | 11 |
| Metamorphosis – East Memorial Wall – South Lawn Memorial | 40996.41 | 42 | 31590.68 | 9411.94 | 30.09 | 12.07 | 42 |
| Lullabyland Memorial – Renton Aerie No 1722 F.O.E. – Love Forever Headstone | 8879.93 | 9 | 8432.42 | 445.28 | 8.03 | 0.57 | 9 |
| Lullabyland Memorial – Renton Aerie No 1722 F.O.E. – Sun Dial | 6078.77 | 6 | 5796.84 | 283.38 | 5.52 | 0.36 | 6 |
| All to Myself I Think of You Memorial – Renton Aerie No 1722 F.O.E. – Cedar View Memorial | 13253.80 | 17 | 0.00 | 13253.80 | 0.00 | 16.99 | 17 |
| Love Forever Headstone – Fish Fountain – Prisoner of War Memorial | 3727.71 | 4 | 3727.71 | 0.00 | 3.55 | 0.00 | 4 |
| Yeah Yeah Thanks Puddin – Remembered Forever – Fountain of Youth | 5989.93 | 6 | 5989.93 | 0.00 | 5.70 | 0.00 | 6 |
| Metamorphosis – Jimi Hendrix Memorial – South Lawn Memorial | 13387.71 | 13 | 13387.71 | 0.00 | 12.75 | 0.00 | 13 |
| Garden of Harmony – Love Forever Headstone – Fish Fountain | 2100.09 | 2 | 2100.09 | 0.00 | 2.00 | 0.00 | 2 |
| Garden of Harmony – Remembered Forever – Fountain of Youth | 3170.97 | 3 | 3170.97 | 0.00 | 3.02 | 0.00 | 3 |
| Iu-Mienh Community Memorial – Fish Fountain – Prisoner of War Memorial | 2119.20 | 2 | 2119.20 | 0.00 | 2.02 | 0.00 | 2 |
| Metamorphosis – Memorial Fountain – South Lawn Memorial | 18014.80 | 17 | 18014.80 | 0.00 | 17.16 | 0.00 | 17 |
| Garden of Harmony – Iu-Mienh Community Memorial – Fountain of Youth | 3235.97 | 3 | 3235.97 | 0.00 | 3.08 | 0.00 | 3 |
| Iu-Mienh Community Memorial – South Lawn Memorial – Prisoner of War Memorial | 9797.50 | 9 | 9797.50 | 0.00 | 9.33 | 0.00 | 9 |
| Garden of Harmony – Love Forever Headstone – Remembered Forever | 3271.66 | 3 | 3271.66 | 0.00 | 3.12 | 0.00 | 3 |
| Lullabyland Memorial – South Lawn Memorial – Prisoner of War Memorial | 3368.27 | 3 | 3368.27 | 0.00 | 3.21 | 0.00 | 3 |
| Lullabyland Memorial – Love Forever Headstone – Prisoner of War Memorial | 3508.58 | 3 | 3508.58 | 0.00 | 3.34 | 0.00 | 3 |
| Lullabyland Memorial – Sun Dial – South Lawn Memorial | 3579.07 | 3 | 3579.07 | 0.00 | 3.41 | 0.00 | 3 |
| Garden of Harmony – Iu-Mienh Community Memorial – Fish Fountain | 2475.69 | 2 | 2475.69 | 0.00 | 2.36 | 0.00 | 2 |
Time passed
The method for finding and verifying the cell weights was really painful because it involved looking at portals and fields in a browser, calculating areas in javascript in a browser, but computing cell coverings and finding the intersections of fields with cells in C++. So I took a break from data collection and analysis to write a web server in C++ that could do the s2geometry work of finding cell polygons and calculating intersections and serve the resulting data back to the javascript browser client. That work is here.
Now I’m deciding if I want to go back to data collection and analysis now or do the next programming task. If I go back to data, I’ll be typing field coordinates into an html file and I’ll be copy-pasting from the javascript console in chrome to Excel to find cell weights that work. The alternative is entering the fields with clicking on map markers and typing the MU values into a dialog box (for the data entry) and putting the output of the area calculations into a Google Sheets div. The “Excel” work could be done on the same page that has the map showing cell coverings and portals.
I think the answer is that I need to do some more data collection and analysis first. I haven’t yet determined if more than one s2 cell level is needed or what level it is if there’s only one. And there’s still the possibility that the population data actually used by Niantic is in some other form than s2 cells with per-cell weights. Once those questions are answered, it’ll make sense to invest in better tooling to eventually come up with an MU calculator for my play box.
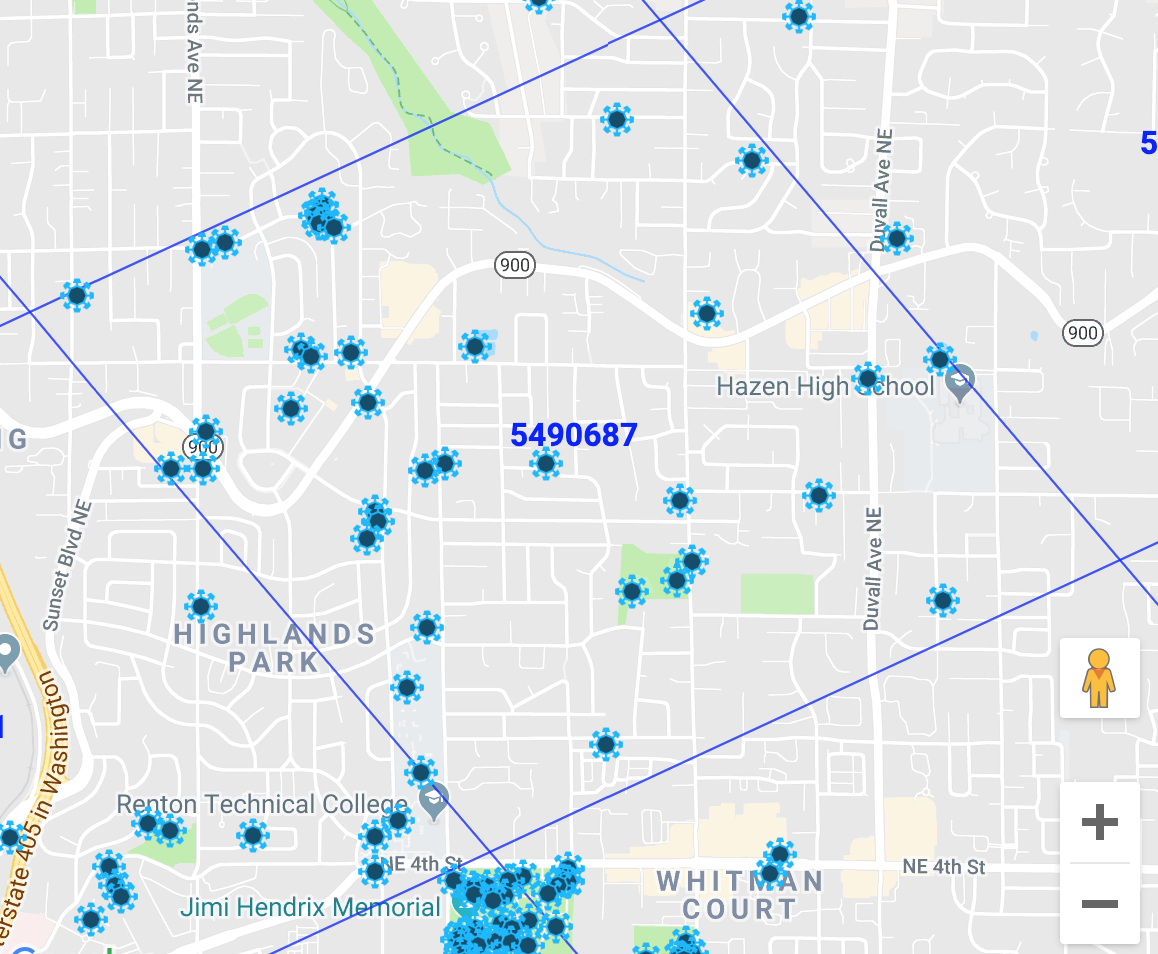
And so level 12 cell 5490687. Is it all the same population value?
Things are happening!
It’s starting to look like something.
The try-numbers-in-Excel-until-it-seems-to-work method broke down, so I replaced it with an algorithm.
- For each field that intersects only one level 14 s2 cell, find a range of cell weights for that cell considering MU – 0.5 and MU + 0.5. If there is more than one field contained entirely within that cell, constrain the min/max weights using the max min and the min max.
- While something is found:
- For each field that hasn’t been “solved”
- If all but one of the intersecting cells has a range of weights, solve for that unknown cell weight using the known weight ranges.
- If all of the cells have ranges, constrain the largest range by solving for that cell weight.
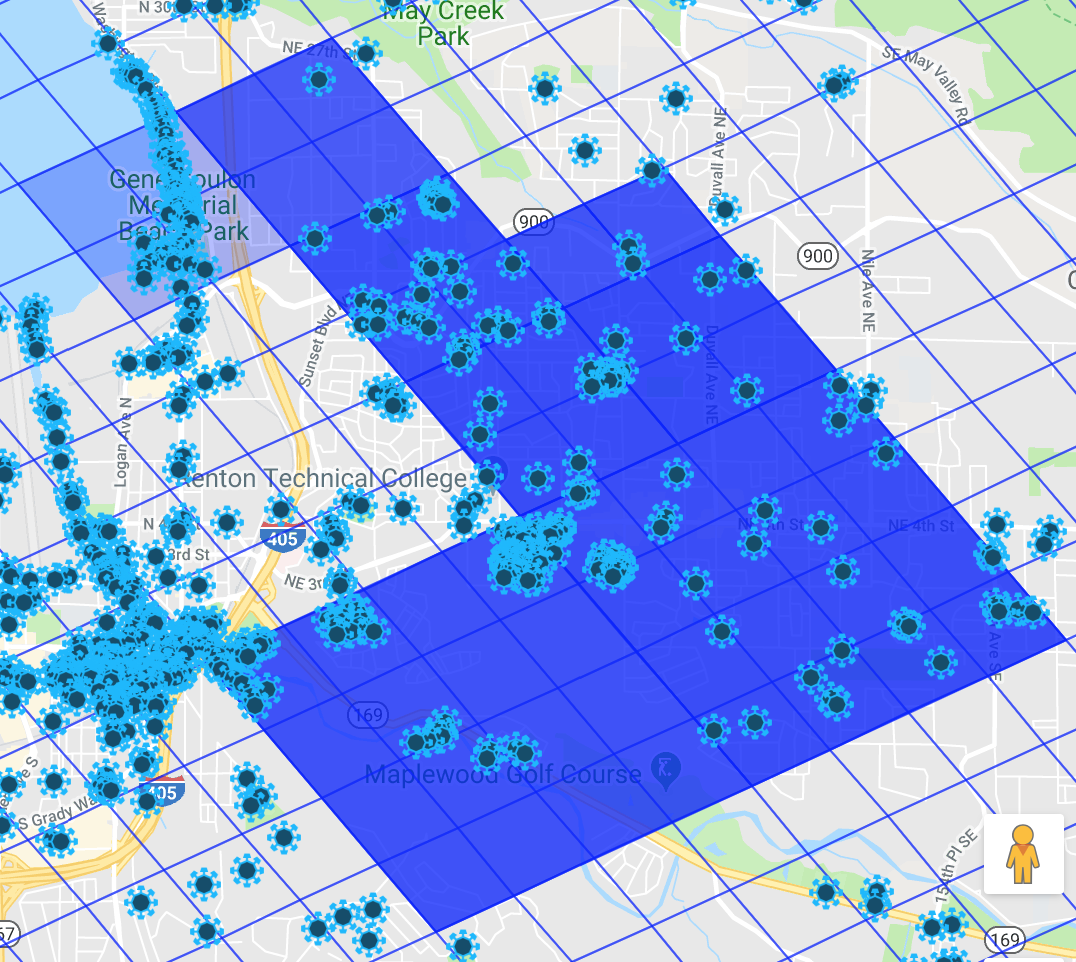
- For each field that hasn’t been “solved”
In the above screen shot, dark blue represents more MU and light blue represents less MU. The missing pieces have ranges that are larger than 100. (Weights, remember, are MU = area in meters divided by weight. So they tend to be between 600 and 1000 in my neighborhood.)
I’ve got a few more fields for the missing chunk of 5490686c but it’s not solvable, ie the ranges of cell weights don’t overlap. This means that either some of the underlying population data is at a s2 cell level other than 14 or I made a data entry error. I’m going to assume the former and modify the algorithm so if it finds a cell that doesn’t have a solution, it subdivides just that cell into the higher s2 level and starts over. It looks like some of these are level 13. 54906874 for instance all seems to be the same shade of blue.
The current version of the code, in all its crufty hacked up glory, is on my s2geometry server github.

Same data with subdivision.
More data collection
The server in an docker container that almost works on S3:
docker pull gorlow/s2geometryserver
And I found this article that suggests a different way to calculate MU that is pretty compelling. It explains the rare but observable “bigger field has less MU than the smaller field it completely covers” phenomenon, whereas my approach doesn’t. It also is compelling because rather than finding weights to divide areas by, it uses a “how many people live in each level 13 cell” metric which is more concretely tied to the idea of “mind units.” So I’ll be changing the algorithm to try to solve that system of linear almost equations.
January 4, 2021
Years have passed. Now I’m thinking about getting back to this project. When I left it. I was working on a C++ web server, which while a fun little project, isn’t the problem I set out to solve. So yesterday, I played around on the S2GeometryServer EC2 instance a bit and it looks like it’ll be really easy to have an Apache server with PHP support so I can write simple little PHP scripts that call a command line executable that uses the S2 geometry library. Should be a much simpler and more reliable approach.
Also, the approach I was using of finding the S2 cover and using either weights or population counts of the S2 cells wasn’t converging on a solution. Adding data wasn’t coming to resolution, it was just indicating that I needed more data and that the solution must be smaller and smaller S2 cells. That probably means that I wasn’t on the way to a solution.
The How Fields Are Calculated article (https://drive.google.com/file/d/11bCsdH5ZZSRxrEU3eEgEnCzvkMUTWSY8/view) suggests that an S2 cover of the field isn’t used at all. Instead, the smallest S2 cell that completely contains the field is used and the population densities of larger S2 cells are the average densities of their children. So before returning to the S2 cover approach, let’s try this.
Next steps are:
- Get the old REST API working with Apache/PHP calling a console app.
- Add an endpoint for finding the smallest S2 cell that completely contains a given triangle.
- ????
- Profit!
January 4, 2021
Minutes have passed. Starting on rewriting the server so it’s instead a console app and remembering work I’ve done in the past to take console apps that were too slow and making them fast by turning them into servers. Back then, it was changing a batch build process of game assets so that instead of calling a couple of different executables over and over with different inputs, the executables launched and listened for build requests. So the build script the user ran would launch the executables, send them requests over a localhost socket and them close them down when all the assets were built. It was way, way faster because most of the build time wasn’t building, it was launching the apps that did the building. So, this probably isn’t a web scale architecture, this launching an app for every request. Fortunately, it doesn’t have to be.
January 6, 2021
Step 1 of the new 4 step plan complete.
https://github.com/GordonLudlow/s2geometryserver/commit/c58d24aa77c52d4b2223e60ff422ee86a3ea0884
January 8, 2021
The How Fields Are Calculated article is incorrect. For each of the fields of known MU (from a couple years ago), I calculated a population density range of (MU – 0.5)/area to (MU + 0.5)/area (where area is the area of the triangle in m2 as computed by google.maps.geometry.spherical.computeArea). I also used the S2 Region Coverer with max cells set to 1 to determine the smallest S2 cell covering the triangle.
I drew the 1 cell covers and the triangles for a dozen fields as a sanity check and they looked reasonable. In some cases the triangle is only about a quarter the size of the cell, or even less for long skinny triangles, but that’s to be expected using only a single S2 cell.
I grouped the results by S2 cell and found that the range of population densities isn’t consistent for any cell. Here’s one of the simplest examples. A cell for which I had only two triangles.
| 5490685 | 3.0313902590E-04 | 3.0488622490E-04 | valid |
| 5490685 | 5.3561622842E-04 | 5.3870335366E-04 | valid |
| 5.3561622842E-04 | 3.0488622490E-04 | invalid |
One of the triangles has an MU density between .000303 and .000305 and the other triangle has an MU density between .000536 and .000539. Regardless of whether the MU density of this cell was computed by averaging its children or pulled directly from some database, there is no possible value of MU density for this cell that results in the two fields having their observed MU values.
These results are unfortunate because it it were as simple as outlined in How Fields Are Calculated, it would be quite straightforward to make a database of population densities by cell.
Also, the How Fields Are Calculated approach is quite compelling because it would be so much easier to implement and maintain than the approach I was previously assuming of generating a cell cover and intersecting the triangle with each cell in the cover and computing the area of each intersection.
January 11, 2021
I suspect that How Fields Are Calculated article is correct with respect to the MU dilution problem being due to large cells using the average of the population densities of their children. My mistake was in assuming that the S2 Region Coverer was being called with minLevel == maxLevel (the level for which they have population data) and maxCells set to a really large number (10,000 or 100,000). Their mistake was assuming that it was being called with maxCells set to 1. It’s likely that it’s called with minLevel set to the level for which they have population data, maxLevel set to the largest possible s2 level and maxCells set to some reasonable number so it’s not too much work to do the intersections and find the areas. When the field is small, the result will be using the minLevel and no MU dilution will occur. When the field is large, the result will include some larger cells and could have MU dilution (or inflation). Not knowing what “some reasonable number” of cells is will make it a little bit trickier to reverse engineer.
In the meantime, I might play around a bit with displaying the fields for which I have data with some kind of heat map of their MU density (without any of the attempts at solving systems of linear inequalities).
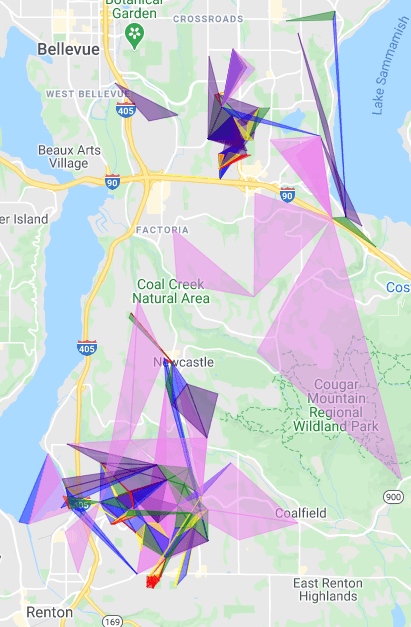
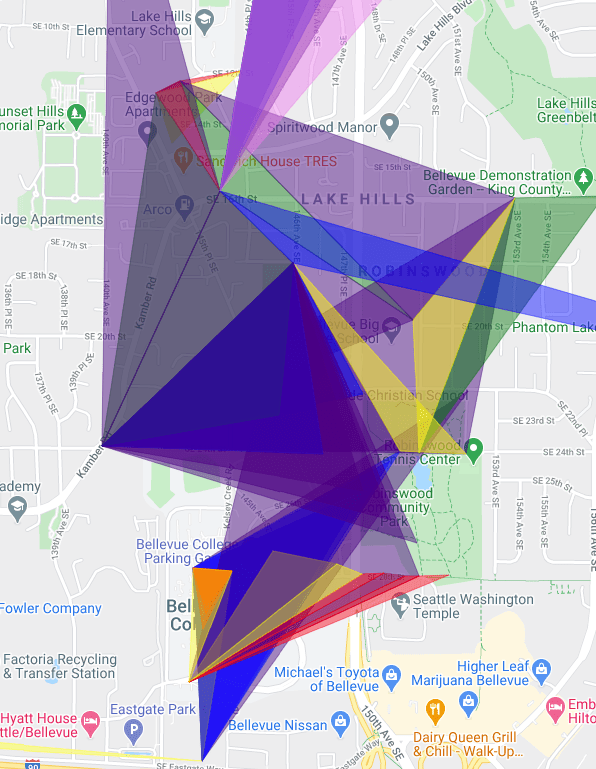
Also January 11, 2021
These MU densities are color coded using rainbow colors with the hotter colors (red, orange, yellow) representing higher density areas and the cooler colors (blue, indigo, violet) indicating low MU density. The red seems to be right next to the violet. The reddest spot is the cemetery where I started. Makes me wonder how good my data collection was. Pretty much none of it looks like gradations of color through the spectrum.
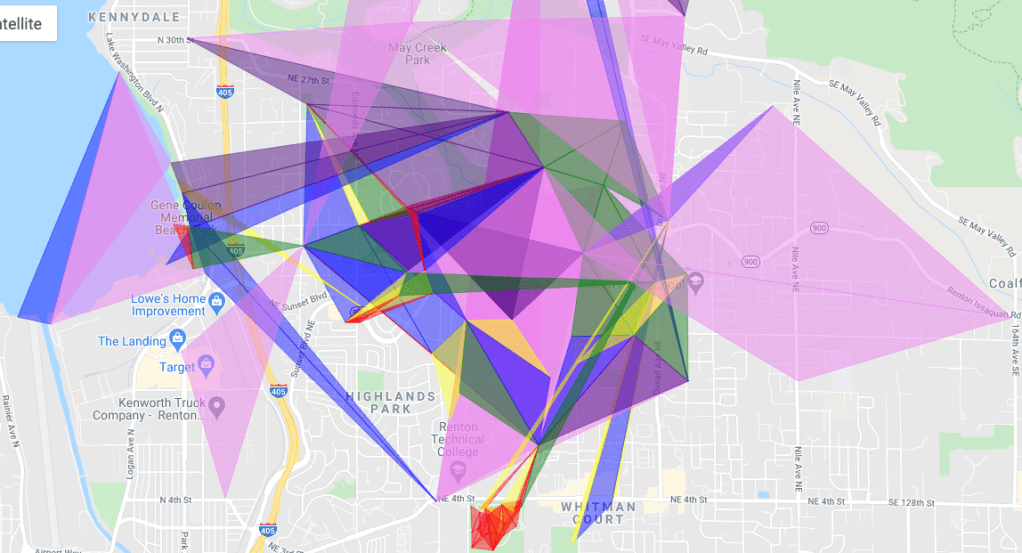
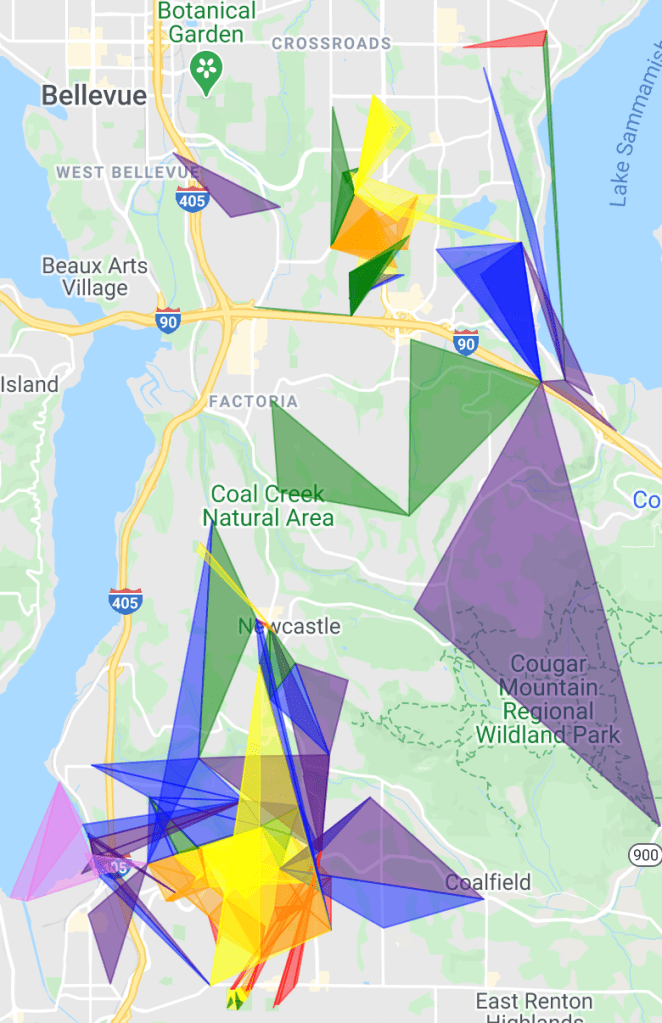
January 19, 2021
A funny thing happened. Looking at those fields, it seemed like the smaller the field, the redder and the larger the field, the more violet. So I added some UI widgets to control what area range of fields to display. Now the colors are a lot more believable. I must have had some bug in the first version, but I didn’t commit it to source control, so ¯\_(ツ)_/¯
February 7, 2021
Added a s3 cell level to the javascript dump of known fields and found that the smallest cell any of the fields fit in is level 15. The reason for this is simple. I avoided any 1 MU fields because they don’t give enough information. Any MU from 0.000000000000001 to 1.999999999 might be called 1, so it doesn’t help much to solve the system of linear inequalities.
So the next step is to grab some data from a high population density, high portal density neighborhood. Since New York City isn’t readily available (I mean, I supposed I could watch a L16 cell in NYC in the intel map hoping someone throws a 2 MU field entirely within it, but that seems slow and error prone), I’ll try downtown Seattle. First attempt will be the International District and if those fields are 1 MU then I’ll try the Central Business District.
In the International District, there’s a L16 cell with 13 portals in it.
Largest without Japantown: https://intel.ingress.com/intel?ll=47.59889233333333,-122.32546933333333&z=12&pls=47.599121,-122.324585,47.598468,-122.325228_47.599121,-122.324585,47.599088,-122.326595_47.598468,-122.325228,47.599088,-122.326595
Largest without International Glyphs: https://intel.ingress.com/intel?ll=47.598932999999995,-122.325609&z=12&pls=47.599121,-122.324585,47.598482,-122.325902_47.599121,-122.324585,47.599196,-122.32634_47.598482,-122.325902,47.599196,-122.32634
Largest without International District Map: https://intel.ingress.com/intel?ll=47.598974,-122.325693&z=12&pls=47.599088,-122.326595,47.599357,-122.324952_47.599088,-122.326595,47.598477,-122.325532_47.599357,-122.324952,47.598477,-122.325532
February 7, 2021
Great news! That first field is 29 MU. So if level 16 S2 cells don’t work, there’s almost certainly level 17 cells with a few fields in them greater than 1 MU in downtown Seattle. Meanwhile, I’ve got several trips to Hing Hay Park in my future to collect more data. If I’d thought of it while I was still there, I’d have grabbed a couple small fields outside the big triangle. They’re a quarter to a third the area of the big one, but that’s still big enough with that MU density.
February 9, 2021
I found a bug! Javascript lambda capture bit me again. Re-running the script that finds the MU density ranges for each cell based on cell cover with maxcells = 1 shows consistency for all cells level 13 and up. So the population data is probably at level 13.
